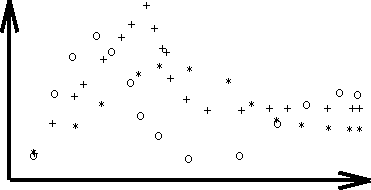
 18.5. Polymarker.
  18.5. Polymarker.
 Instead of drawing lines through a set of points, we may
wish just to mark the points.

 Mark the points, construct a polynomial to fit the points if possible

via some fit technique and then generate a line from the polynomial.


Fig. 18.2 : Polymarker plots

 Use different polyline representations to give different curve fitting

approximations.


             1            .

             2            +

             3            *     Note all of these will be centred.

             4            O

             5            X

A marker types can be associated with an index via
set polymarker representation(WS,PMI,MT,MS,PMCI)
WS = workstation PMI = Polymarker Index
MT = marker type defined as above.
MS = marker scale factor = as for LW in polyline.
PMCI = Polymarker Colour Index.
How do we implement polymarker?

 Could use symbol to position draw '.', '+', 'X', 'O', etc.

Or could use plot to position and then do relative draws to

produce + * O.

First would be easiest but would cause problems in size and

possibly colour attribute realization.

Therefore use plot type implementation.

GKS exists at a number of implementation levels, i.e. supporting output, input, segments, etc. Each of these levels are defined and allow a gradual implementation to develop.


