 18.3. Polyline - main line drawing primitive.
  18.3. Polyline - main line drawing primitive.
                  Polyline(N,X,Y)

 Note we will use a high level notation for the routines allowing

spaces in names.

    N is number of points (X[1],Y[1]) to (X[N],Y[N])

    N is of type integer and X,Y are variables sized arrays of reals.

 This concept allows efficient drawing of n-1 line segments on most devices at

 the expense of storage required for the array. Is this a real problem?


         X[i] := minX + (maxX - minX)*i/255

         Y[i] := f(X[i]);


         FOR i:= 1 TO 100 DO

             readln(X[i],Y[i]);


 Notice that we do not have any specific "Move" primitive. This is done

automatically

- move to (X[1],Y[1]) and then draw to (X[2],Y[2]) and subsequent points.

There is no current position concept - the pen or drawing position is only

relevant when a primitive is executed not before or after.

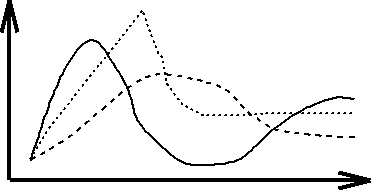
When graphing data it might be nice to differentiate
between different plots or between the plot and the axes.
To do this we need to be able to set the line drawing attribute. This is done via

Fig. 18.1 : Polyline plots

          Index 1   may be solid - default

               2   may be dashed

               3   may be dotted

               4   may be dash-dotted

             set polyline index (1); polyline (N,X1,Y1)

             set polyline index (2); polyline (M,X2,Y2)

Colour : colour of line is important and this can be set as can
the line width by a call to

       set polyline representation(WS, PLI, LT, LW, PLCI)


    WS   is workstation in question.

    PLI  is number of polyline index

    LT   is line type

    LW   is line width

    PLCI is polyline colour INDEX


(For pens in plotter may be   0 = white

                           1 = blank

                           2 = red      etc.).

GKS allows the user to setup the colour lookup table for different workstations: set colour representation (WS, CI, R, G, B)
Where CI is colour index and R, G, B are real values between 0
and 1 representing the intensities of the Red, Green and Blue
colours.

                           R   G   B

         what is black?      0   0   0

                white?      1   1   1

                yellow?     1   1   0      Red and Green

                blue?       0   0   1


