 15. Clipping and Covering.
  15. Clipping and Covering.
 Clipping and covering are two important aspects of graphics
design work.

 We may wish to see only the lines within a particular rectangular area

(and then perhaps expand that area to fill screen).

We may also wish to leave a rectangular space free to write a

message "over" a complicated diagram.

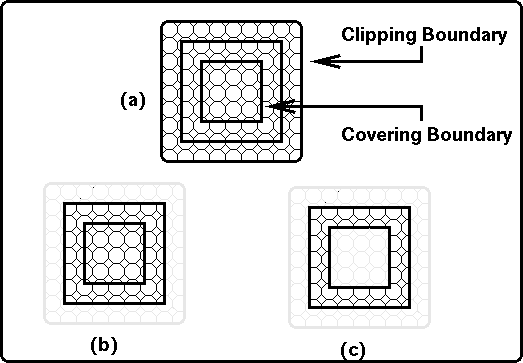
Figure 15.1a shows a typical graphics scene.
Fig. 15.1 : Clipping and Covering example
Newman and Sproull gives a Pascal algorithm for determining if a line is within/without the clipping area (Page 66-67). As an alternative (and possibly easier to understand) algorithm we shall look at a (typically FORTRAN) algorithm given by Angell based on Cohen and Sutherland ( see http://cs.fit.edu/courses/cse4255/cse5255/naklek/linec.html or http://www.ul.ie/~flanagan/gsoft3/gsoft3.html ).

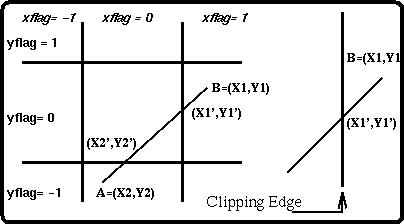
Fig. 15.2 : Clipping Algorithm

Assumptions:

             (1)  Origin is at centre of clipping region.

             (2)  Rectangular clipping region is 2dx,2dy "inches".

             (3)  Therefore, vertices of rectangle are (+dx,+dy).

             (4)  We have extended the boundaries of our clipping region

                     to create nine sectors in our space.


Consider 3 possibilities


 (1)

         XFLAG1=XFLAG2  )     line is totally outside clip region

    or  YFLAG1=YFLAG2  )         therefore ignore

         not equal to 0


 (2)

         XFLAG1=XFLAG2=YFLAG1=YFLAG2=0 => line segment is totally within

                                       clip region, therefore draw

                                       totally.


 (3)

 If XFLAG1 # 0 or YFLAG1 # 0 then (X1,Y1) lies outside the clipping

region, therefore calculate a new point (X1',Y1') which is on the clipping

region boundary. Point (X2',Y2') is calculated in a similar manner.

Required clipped line segment is now (X1',Y1') to (X2',Y2').

If (X1',Y1')=(X2',Y2') then single dot -> forget it.


       subprogram mode (x,y,dx,dy:real;xflag,yflag:integer)

       real x,y,dx,dy;        integer xflag,yflag;

         xflag <- 0; yflag <- 0;  (*assume internal*)

         if (abs(x) >dx) then     (*if outside region*)

           xflag <- sign(x); (*sign(x)=-1 if x<0,1 if x>0*)

         endif;

         if (abs(y) >dy) then     (*if outside region*)

           yflag <- sign(y);

          endif;

       end_subprogram_mode.


       subprogram clip(x1,y1,x2,y2)

       local real xflag1,xflag2,yflag1,yflag2,x1',x2',y1',y2';

          {set x' y' to end points. }

         x1' <- x1;   x2' <- x2;   y1' <- y1;   y2' <- y2;

          { get modes for these two points. }

         call       mode (x1',y1',dx,dy,xflag1,yflag1);

         call       mode (x2',y2',dx,dy,xflag2,yflag2);

         if (xflag1*xflag2=1) or (yflag1*yflag2=1) then return;

          endif

         if xflag1<>0 then

                  xx <- dx*xflag1;

              y1' <- y1' + (y2'-y1')*(xx-x1') / (x2'-x1');

              x1' <- xx; call mode(x1',y1',dx,dy,xflag1,yflag1);

         endif;        {move x1 to clip boundary or vertical extension.}


         if yflag1<>0 then

              yy <- dy*yflag1;

              x1' <- x1' + (x2'-x1')*(yy-y1') / (y2'-y1');

              y1' <- yy;

         endif;        {move y1 to clip boundary or horizontal extension}


         if xflag2<>0 then

              xx <- dx*xflag2;

              y2' <- y1' + (y2'-y1')*(xx-x1') / (x2'-x1');

              x2' <- xx; call mode(x2',y2',dx,dy,xflag2,yflag2);

         endif;        {Same as above for x2.}


         if yflag2<>0 then

              yy <- dy*yflag2;

              x2' <- x1' + (x2'-x1')*(yy-y1') / (y2'-y1');

              y2' <- yy;

         endif;        {And y2.}


         if (abs(x1'-x2')<0.00001) and        (*Is it degenerate case?*)

          (abs(y1'-y2')<0.00001) then   return;

         endif


         call plot(x1',y1',3);          call plot(x2',y2',2);

       end_subprogram_clip.

(1) Calculate translation and rotation matrix and pre-multiply
each end point etc. by this.
(2) Now un-transform the points (by rotating other direction
and translating in other direction) to draw the line segments.
Remember that we may be working relative to a new origin in our
plot calls because of plot (x,y,-N).
Covering is similar but our tests now eliminate lines
within the covered region.

 (1) Use MODE to ascertain our (X1',Y1'), (X2',Y2').


 (2) If NOT DEGENERATE CASE then


 (3) Get on (X1',Y1') move to (X1,Y1) draw to (X1',Y1').


 (4) Get on (X2',Y2') move to (X2',Y2') draw to (X2,Y2).

call cursor (X1,Y1)
call cursor (X2,Y2)
(* (X1,Y1)(X2,Y2) now are diagonals of rectangular grid to use for clipping or covering*).
How useful is this clipping routine to us (i.e. plot( ))?
We do not normally plot from one place to another but from
the current position to the position specified.

What changes are necessary?


Just as lines are clipped or covered, textual strings
should also be clipped or covered.

 How to clip?

What to clip?

(1)
Clip entire string if any part of it goes outside the
clipping region.
(2)

Fig. 15.4 : Clipping of entire string
(3)

Fig. 15.5 : Clipping entire character

Fig. 15.6 : Clipping within a character
Normally the second approach is taken with the following
test being performed:

       if x+char_width > clipxr or

         x           < clipxl or

         y+char_height > clipyt or

         y           < clipyb then (* no character drawn *)

       else    (*draw this character. *)

TEX and METAFONT by Donald Knuth describes methods of generating high quality STROKE type characters via plot commands without having to use hundreds of points.
Note that the height and/or the width of the character may change depending upon the size of character required.
Normally no clipping is done - if you draw outside the 0.0
-> 22.0, 0.0 -> 16.75 an error is reported. With clipping, calls
to plot for a move change the current position and do not
necessarily cause a move command to be sent out to the device.
The clipping is done between the current position (cx,cy) and the
(x,y) position specified in a draw request.


